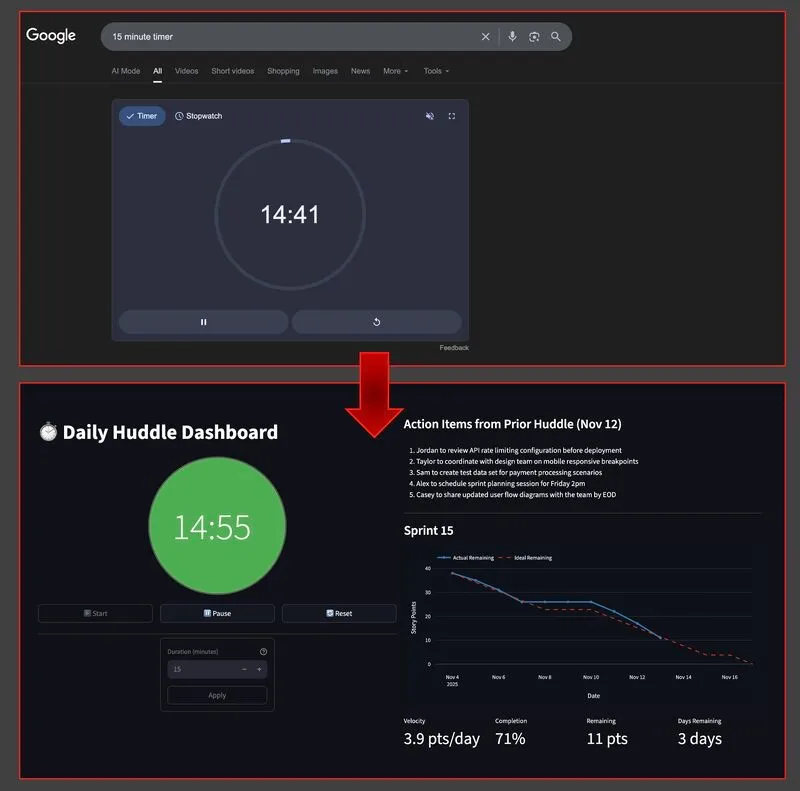
To run remote daily standups over Teams I have to share my screen with an online timer to keep the conversation focused. However, screen sharing one app means I can’t easily share two other items that would be beneficial for the huddle: action items from the prior huddle and the sprint burndown chart. The stock burndown chart from Jira presents another problem. Our workflow has two completion states (“Done” and “In Production”), but Jira only counts “In Production” as complete, so our burndown chart always shows us behind schedule even when development is on track. So I set out to build a Python app to create a custom standup dashboard.
I started with a requirements session using Gemini to think through the data pipeline. Getting action items from Read.ai meant hitting several dead ends (webhook approach, Playwright scraper) before reaching a solution that worked: Read.ai pushes meeting transcripts to Zapier, which saves text files to Google Drive with standardized filenames. My dashboard reads the local synced files based on the current date.
Moving to implementation, I started with Claude Code in plan mode. I documented design goals (modularity, separation of concerns, reusability, test coverage) upfront in the project’s CLAUDE.md file, and then I had Claude create an implementation plan based on the transcript of the chat with Gemini. The burndown chart came from another Python app I built for sprint planning. I used Claude Code to create a porting guide from that app, which was then added to the implementation plan.
The final dashboard is built with Streamlit and runs locally. It displays a configurable timer, automatically loads action items from the previous meeting, and a sprint burndown chart that counts both completion states. A separate analysis app runs daily to pre-calculate burndown data from Jira, so the dashboard loads instantly during meetings.
What did I learn? Technical PMs can now prototype and deliver internal tools that directly solve team friction points without competing for developer resources. Spending enough time product planning and designing remains as important as ever to ensure building the right thing, the right way.
The entire project took about 4 hours over one week. Technical stack: Python, Streamlit, Plotly, with data sourced from Read.ai via Zapier and Jira API.